Price takes out a key high or low and you jump in, expecting a clean trend continuation. Moments later the market snaps back and stops you out. These false breaks frustrate even experienced traders.
Market structure breaks and liquidity sweeps often look identical on the chart at first glance. One signals a genuine shift in control. The other simply grabs stops before reversing. Learning to tell them apart dramatically reduces the number of fake signals you act on. Here’s how to make the distinction with more confidence.
What a True Market Structure Break Looks Like
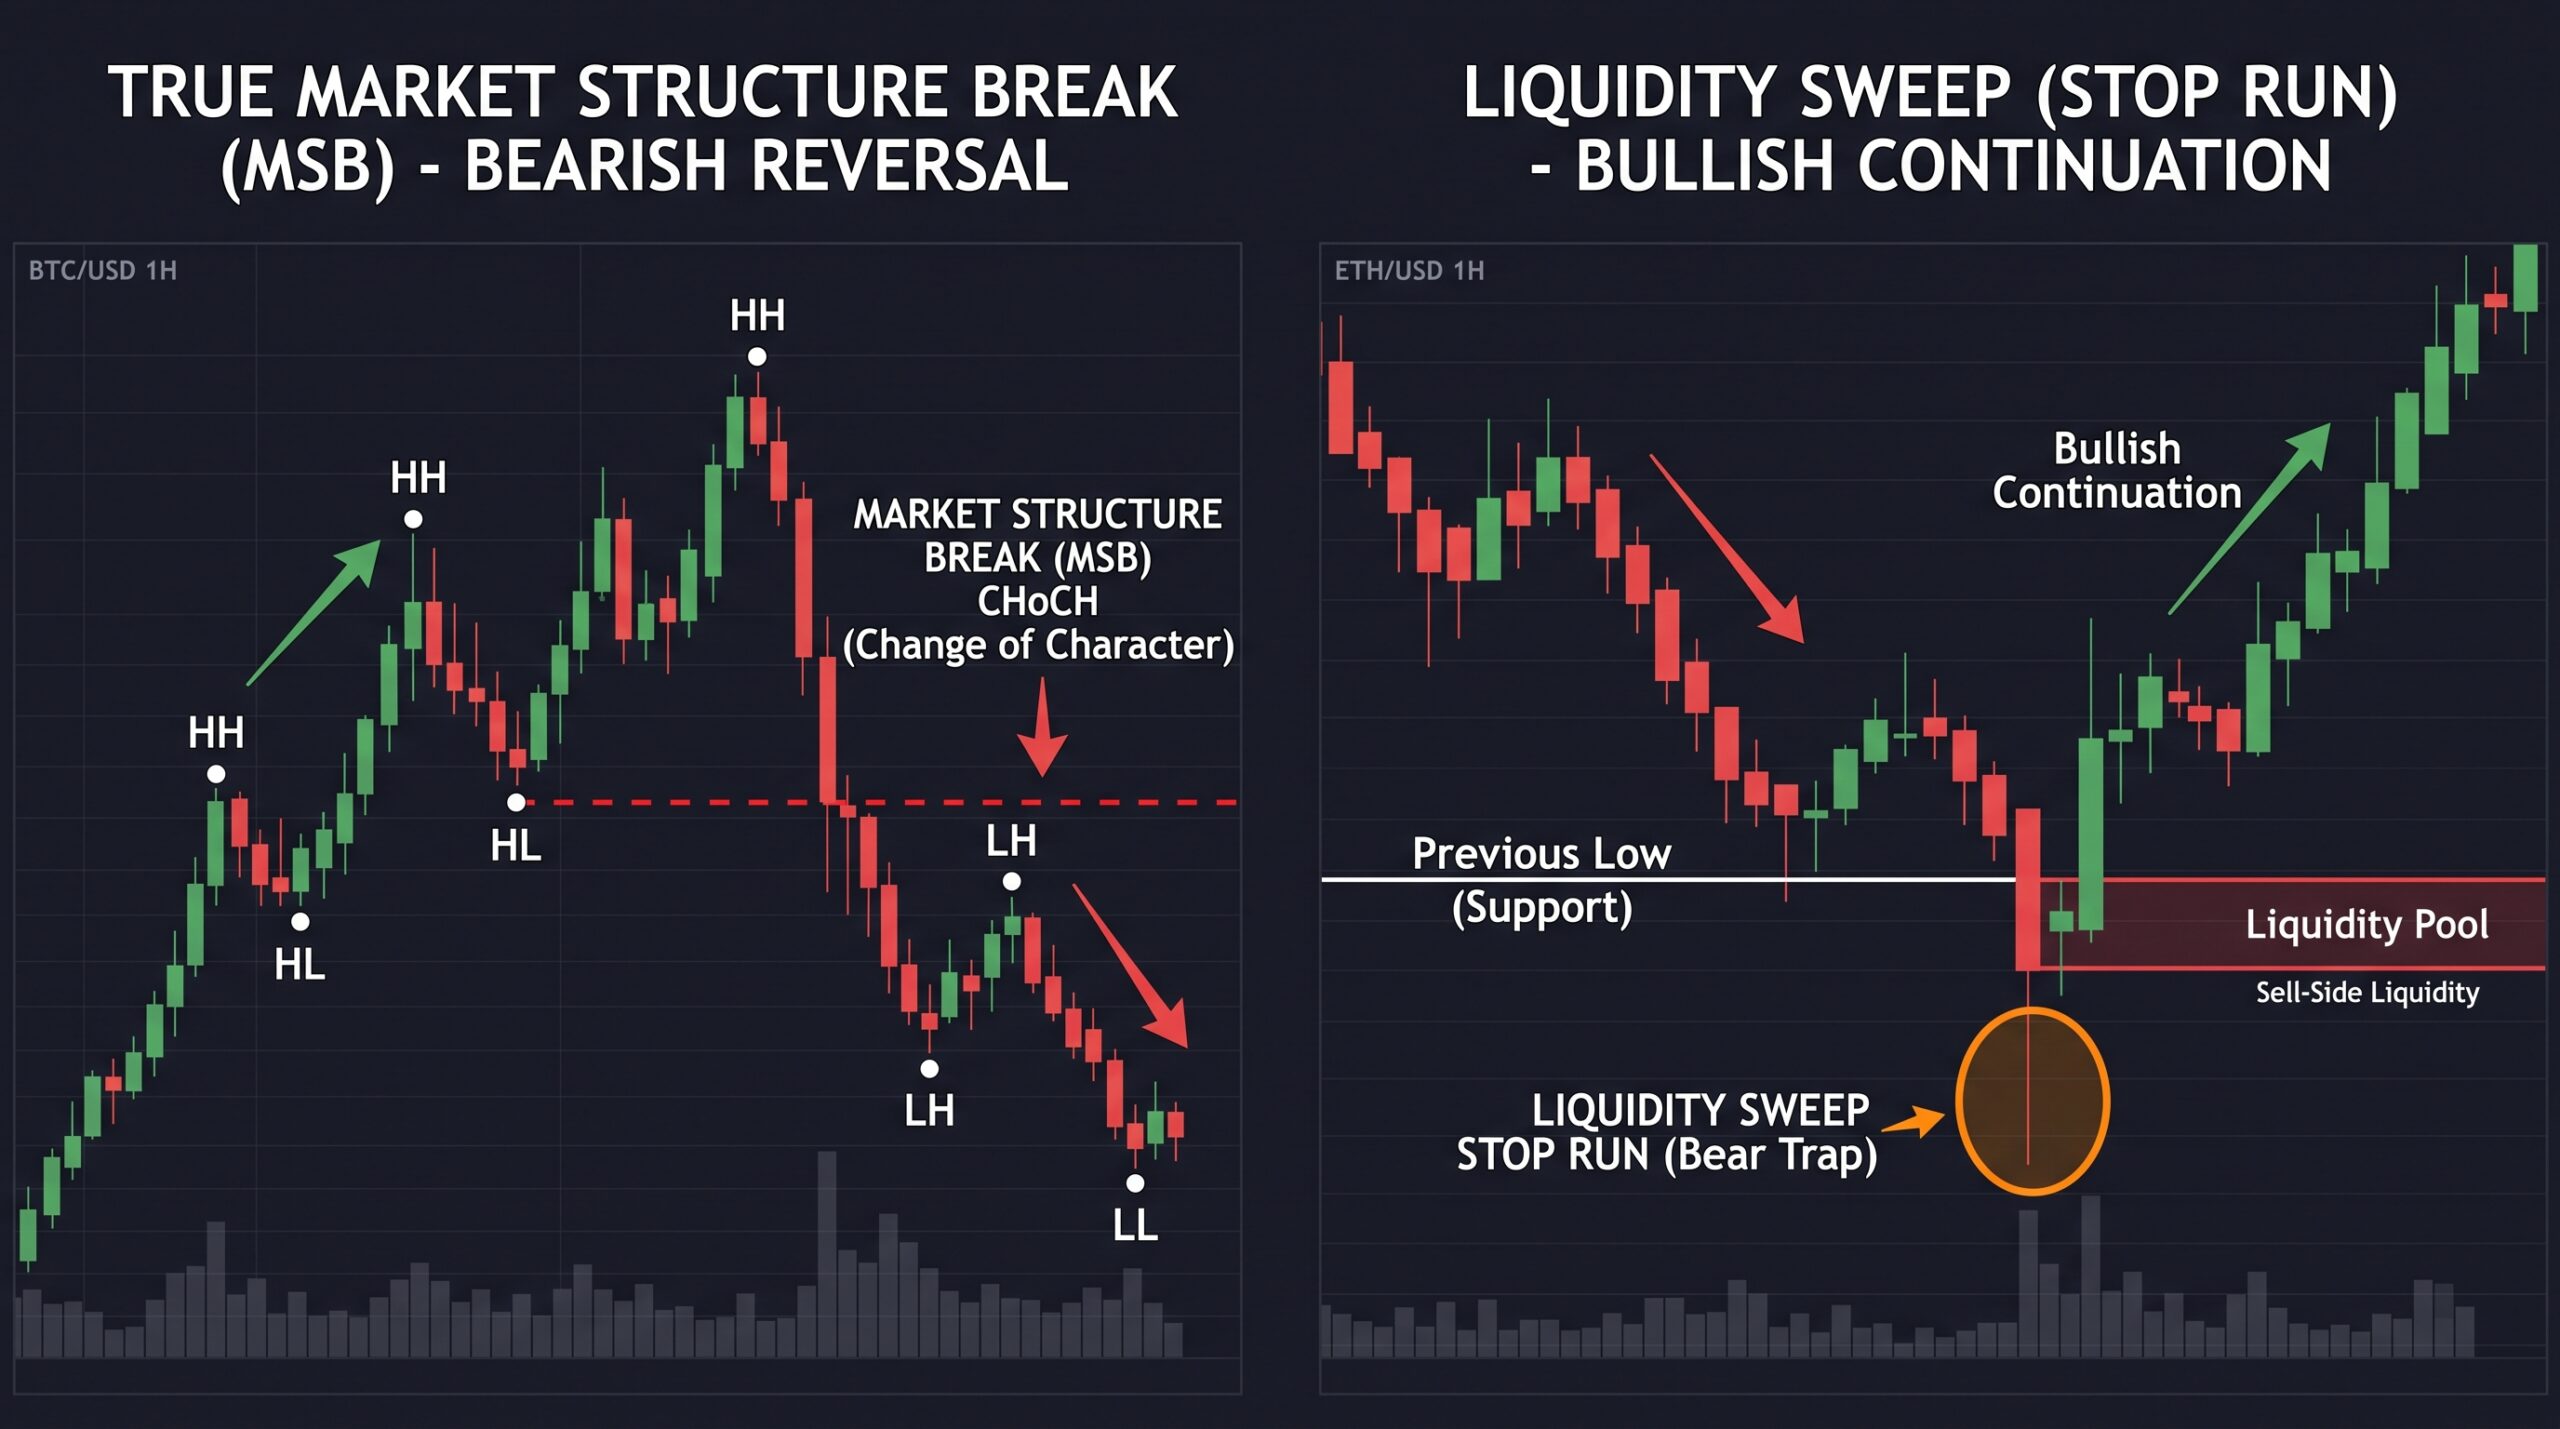
A genuine market structure break occurs when price closes beyond a significant swing high or low with conviction and then continues in the new direction. In an uptrend, a break below a major higher low that is followed by lower highs and lower lows suggests the bullish structure has shifted.
Volume, momentum, and follow-through help confirm the change. A strong impulsive candle that closes well beyond the level and is followed by continued pressure carries more weight than a brief wick. Higher-timeframe structure always matters more than lower-timeframe noise.
When the break aligns with a clear change in character across multiple timeframes, the odds of a real trend shift increase. These are the breaks worth respecting for directional trades.
How Liquidity Sweeps Differ from Structure Breaks
A liquidity sweep happens when price briefly moves beyond a obvious high or low to trigger stop orders and then quickly reverses. The move is often sharp but short-lived. After the stops are taken, price returns inside the previous range or continues the original trend.
These sweeps frequently occur at equal highs, equal lows, or other obvious technical levels where retail stops cluster. The candle may show a long wick beyond the level with a close back inside the prior structure. That rejection is a classic warning that the break was engineered to collect liquidity rather than start a new trend.
Recognizing the difference protects you from entering right as the market is about to reverse against the crowd.
Practical Filters to Separate the Two
Wait for a candle close beyond the level instead of reacting to the first touch or wick. A close shows stronger acceptance. Then look for follow-through in the next few candles. Genuine breaks tend to continue. Sweeps usually reverse quickly.
Check the higher timeframe. A break that goes against the dominant higher-timeframe trend has a higher chance of being a liquidity grab. Also observe the speed and volume of the move. Extremely fast spikes with immediate rejection often signal a sweep.
In my own trading, adding a simple rule—require at least one full candle close and a subsequent lower-high or higher-low confirmation—cut a large number of false breakout entries. The extra patience pays for itself.
Building a Decision Process Around These Concepts
Mark the key swing points that define current structure on your primary timeframe. Treat those levels as decision zones rather than automatic entry signals. When price approaches them, decide in advance what would constitute a valid break versus a probable sweep.
Combine the structure analysis with order-flow or volume tools when available. Rising volume on a break that continues is more constructive than a low-volume spike that fails. Keep notes on how each significant level resolves so your pattern recognition improves over time.
The goal is not to catch every move. It is to avoid the obvious traps that repeatedly catch traders who treat every break of a high or low as meaningful.
FAQ
What is the main difference between a market structure break and a liquidity sweep?
A structure break shows acceptance and continuation in the new direction. A liquidity sweep briefly takes stops and then reverses.
Should I always wait for a candle close?
Waiting for a close beyond the level filters out many wicks that are only hunting liquidity.
Do liquidity sweeps occur more on lower timeframes?
They appear on all timeframes, but lower timeframes produce more frequent and noisier sweeps.
Can a liquidity sweep turn into a real structure break?
Sometimes. If price rejects, returns, and then later breaks the level with strong follow-through, the character can change.
How do I practice telling them apart?
Review historical charts and mark every significant break. Note which ones continued and which ones reversed after taking liquidity.
Trade the Real Shifts, Skip the Traps
Market structure breaks and liquidity sweeps can look the same in the moment, yet they lead to opposite outcomes. One offers a potential new trend. The other exists mainly to collect stops before reversing.
Train yourself to require confirmation, respect higher-timeframe context, and recognize the typical shape of a sweep. Filtering these false signals keeps you out of low-quality trades and preserves capital for the setups that actually matter. Study the difference on your charts this week and make the distinction part of your decision process.