You have likely watched a price chart plummet toward the 200-day Simple Moving Average (SMA), braced for the legendary “institutional bounce,” and then seen the price crash straight through it as if it weren’t there. We have all been there. For years, the 200-day SMA was the holy grail of market support, a reliable “line in the sand” where long-term investors supposedly stepped in to save the day. But in 2026, the game has changed. The institutionalization of crypto through spot ETFs has introduced a new, complex layer of “reflexivity” that can turn your favorite support indicator into a liability.
If you are still trading based on the assumption that the 200-day SMA is a magical price floor, you are missing the bigger picture. In the current market, this line is no longer just about technical sentiment; it is about the mechanical supply-demand pressure created by massive ETF inflows and outflows. To survive this cycle, you need to understand how these institutional flows are actively bending, breaking, and redefining your most trusted technical support.
The Mechanical Shift: ETF Flows vs. Technical Support
Traditionally, the 200-day SMA held up because retail and long-term holders treated it as a psychological signal to “buy the dip.” Today, Bitcoin’s structure is driven by authorized participants (APs) and ETF issuers like BlackRock and Fidelity. When institutional sentiment shifts, these funds don’t just “wait for a bounce”—they execute programmatic buying or selling to manage their net asset value (NAV).
Expert Insight: Think of the 200-day SMA as a signal for retail, but institutional flows as the engine. If there is a massive macro-driven sell-off, ETF providers are forced to sell the underlying spot Bitcoin to meet redemption requests. If that selling pressure exceeds the organic bid sitting at the 200-day SMA, the line won’t just hold; it will be obliterated. You must track net ETF flow data alongside your technical charts; if ETFs are net-selling, the 200-day SMA is significantly less likely to provide a stable floor.
Reflexivity: How Inflows Redefine the “Floor”
Institutional product inflows have introduced a level of reflexivity where the price action around moving averages becomes self-fulfilling only when inflows are positive. When spot ETFs are soaking up more Bitcoin than miners are producing, the 200-day SMA acts as an incredibly strong magnet for institutional accumulation.
Personal Example: I used to blindly buy when the price touched the 200-day SMA, assuming it was a “value” zone. Last year, during a period of massive ETF outflows, I watched the price knife right through it. I learned that my support level was meaningless because the “Big Money” was busy de-risking, not accumulating. Now, I only consider a bounce near the 200-day SMA as a “buyable” setup if I see a corresponding uptick in net inflows from the major ETFs. If the inflows aren’t there, the support isn’t there.
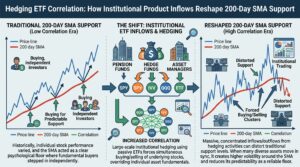
Correlation Risk: When Everything Moves Together
The rise of institutional crypto ETFs has undeniably tightened the correlation between Bitcoin and traditional assets like the S&P 500 or the Nasdaq. Because these ETFs are now integrated into broader wealth-management portfolios and collateral markets (like JPMorgan’s pledge programs), a “risk-off” move in the stock market often forces a synchronized sell-off in crypto ETFs.
Expert Insight: When the correlation spikes toward 1.0, the 200-day SMA on your Bitcoin chart might actually be tracking a broader liquidity drain. Don’t look at Bitcoin in a vacuum. If you see your BTC 200-day SMA getting tested, look at the DXY (US Dollar Index) or the 10-year Treasury yield. If those macro indicators are flashing warning signs, the 200-day SMA support is essentially “pre-broken.”
The “False Break” Strategy for Professionals
Many smart-money traders now look for a “False Break” of the 200-day SMA. They wait for the price to dip below the line—triggering retail stop-losses and automated liquidation bots—and then look for a surge in ETF buying volume to confirm a reclaim.
Expert Insight: Never enter the moment the price touches the 200-day SMA. That’s where the liquidity for the “smart money” to accumulate is found. Wait for the price to drop below the line, wait for the “panic” volume to settle, and only enter if you see a reclaim of the 200-day level accompanied by sustained positive net inflows in the ETF sector. That confluence of “technical reclaim” and “institutional demand” is the only setup you should trust.
The 200-day SMA still matters, but not as a static line in the sand—it matters as a reference point for where institutional capital is deciding whether to defend or abandon the trend. By layering ETF flow data over your moving averages, you gain a massive edge over traders who are still relying on 20th-century indicators. Stop viewing the 200-day as a guaranteed floor; view it as a diagnostic tool. If you can combine technical discipline with an understanding of institutional flow dynamics, you will stop getting caught in “support” traps and start trading the reality of the 2026 market.
FAQ
Why does the price often slice through the 200-day SMA so easily?
Because the 200-day SMA is a lagging indicator. If a macro event (like a sudden change in Fed rates) triggers a massive institutional sell-off, that selling momentum will almost always outweigh the sentiment-based support of a moving average.
How do I check “net inflows” for Bitcoin ETFs in real-time?
There are several reputable dashboards (like SoSoValue or CoinGlass) that track daily net flows for all major US spot Bitcoin ETFs. Checking these once a day is enough to gauge institutional conviction.
Can I use the 200-day SMA for short-term trading?
Generally, no. The 200-day is too slow for short-term scalping. It is best used for identifying the “regime” of the market (bullish vs. bearish) rather than specific entry points.
What happens if Bitcoin stays below the 200-day SMA for a long time?
If the price remains below the 200-day SMA, the trend is considered bearish, and the SMA often flips from a “floor” to a “ceiling” (resistance). In this phase, institutional investors tend to sell into rallies near the line rather than buying at it.